Grafana is an open-source tool for visualizing data from various sources. This analytics platform is used for the graphical representation of time series and text data.
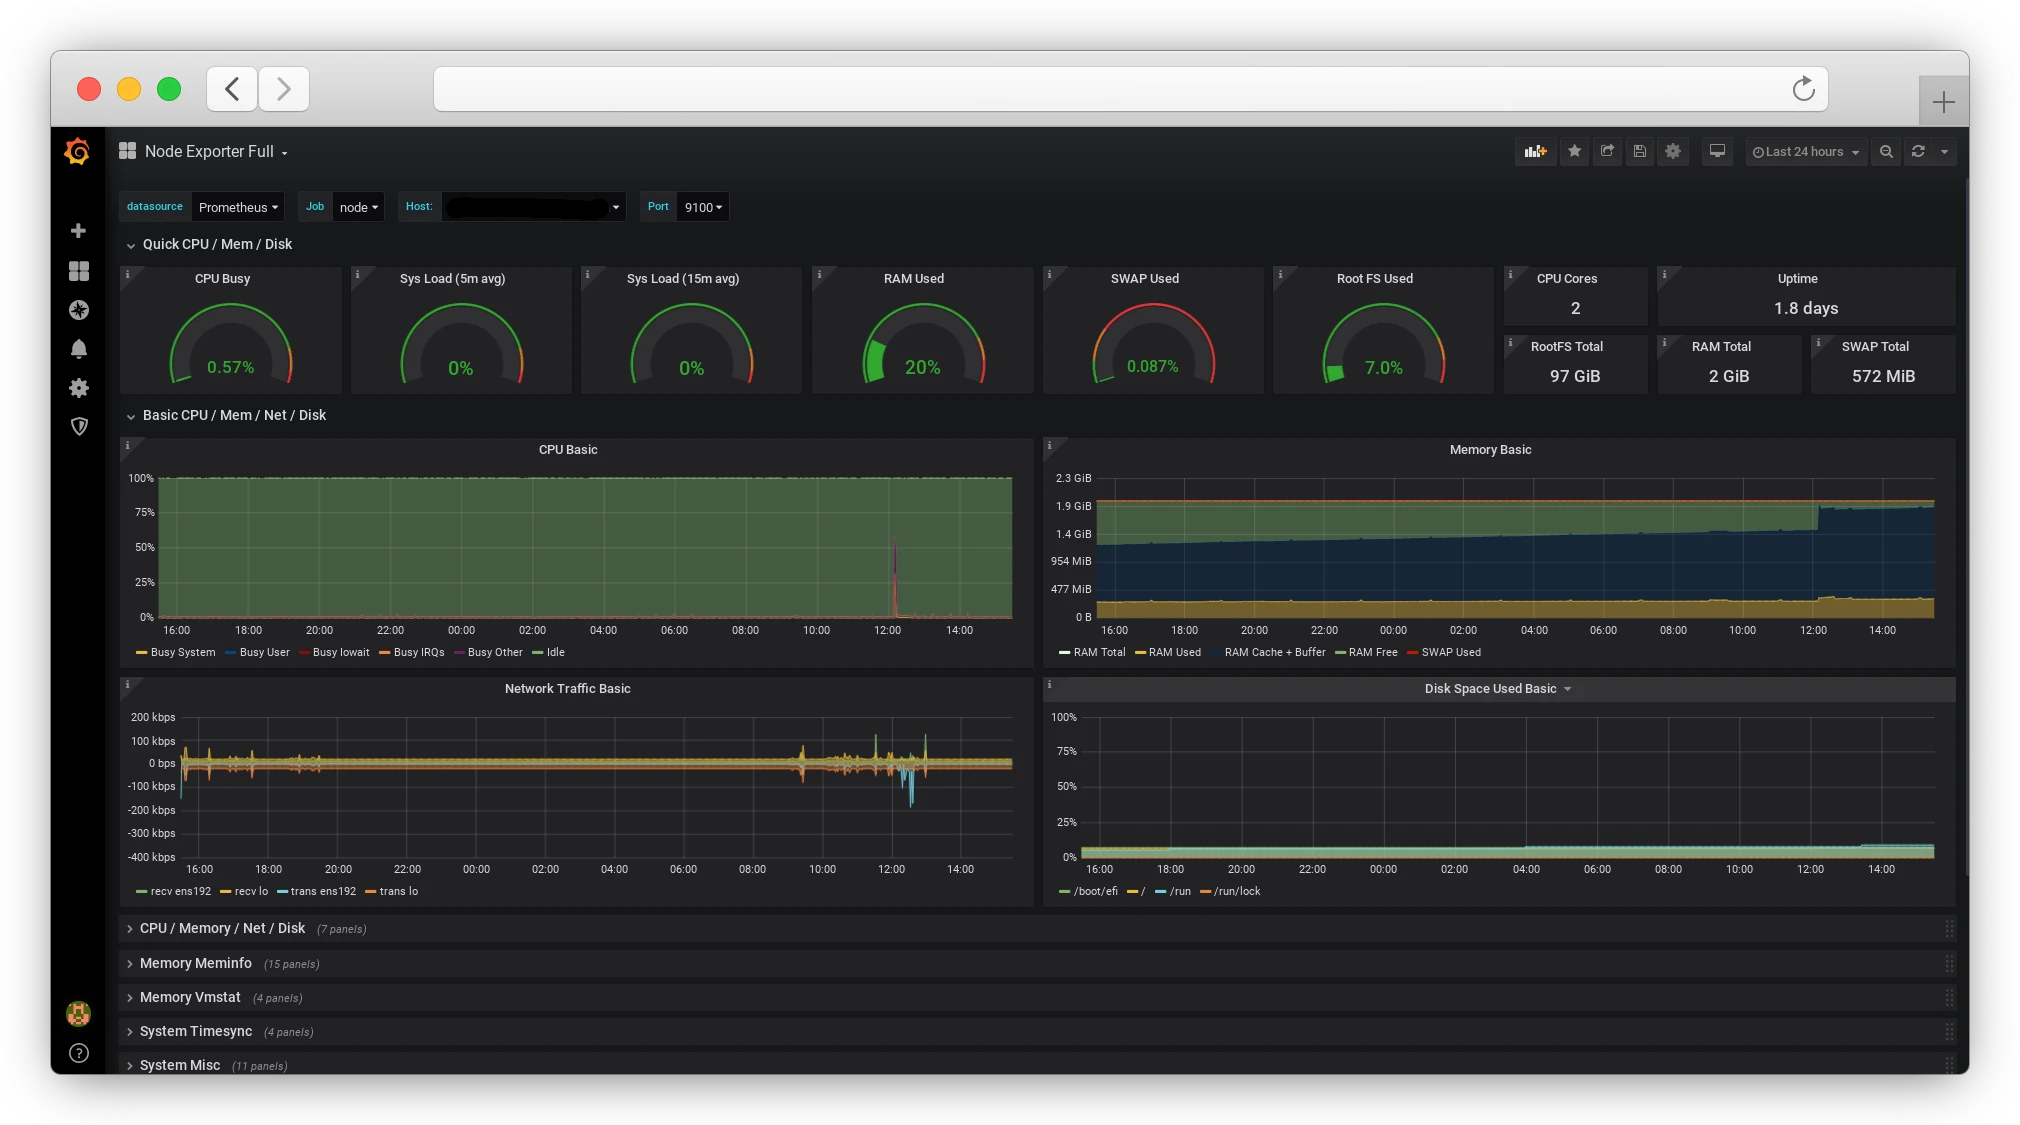
Grafana is a visualization tool that supports a variety of data sources:
- Prometheus;
- Graphite;
- MySQL;
- InfluxDB;
- Elasticsearch and others.
The list of standard datasources can be expanded with many plugins for Grafana, both official and community-created. The data visualization tool has built-in customizable panels that you can start using right away.
The default types of Grafana dashboards:
- Graph – the panel with graphs with the ability to combine multiple metrics in a single panel.
- Gauge – the “speedometer-like”panel with the possibility to limit the upper value on the scale.
- Bar Gauge – the panel with the ability to display metrics on a vertical bar graph.
- Table – the panel with table representation, where you can display the values of several metrics.
- Text – the panel to display arbitrary text (caption).
In addition to the above, there are other additional panels available as plugins for the Grafana visualization tool, both official and created by the community.
The Beget VPS with pre-installed Grafana is an automatically deployed ready-to-use Grafana with an SSL certificate on your domain.
Installation package information
- Ubuntu 22.04
- Docker, latest
- Grafana 11.5.2
- Certbot
Installing Grafana
When installing a server, in addition to the standard parameters you will be asked to specify:
- The domain that will be used to access Grafana. You can specify either an existing domain name or register a new one. It is also available to use a free domain in the .beget.app zone. The SSL certificate will be issued and installed on the selected domain.
- Admin Login. It will be used to log in to Grafana with administrator rights.
- Admin Email. It also can be used to log in to Grafana with administrator rights.
- Password for the administrator account.
Access data will be sent to the specified email.
Getting Started with Grafana
To get started in Grafana, go to https://my-domain.beget.app, where my-domain.beget.app is the domain of your choice. You can also go to the application using the link in the information window of the installed application in the virtual server control panel.
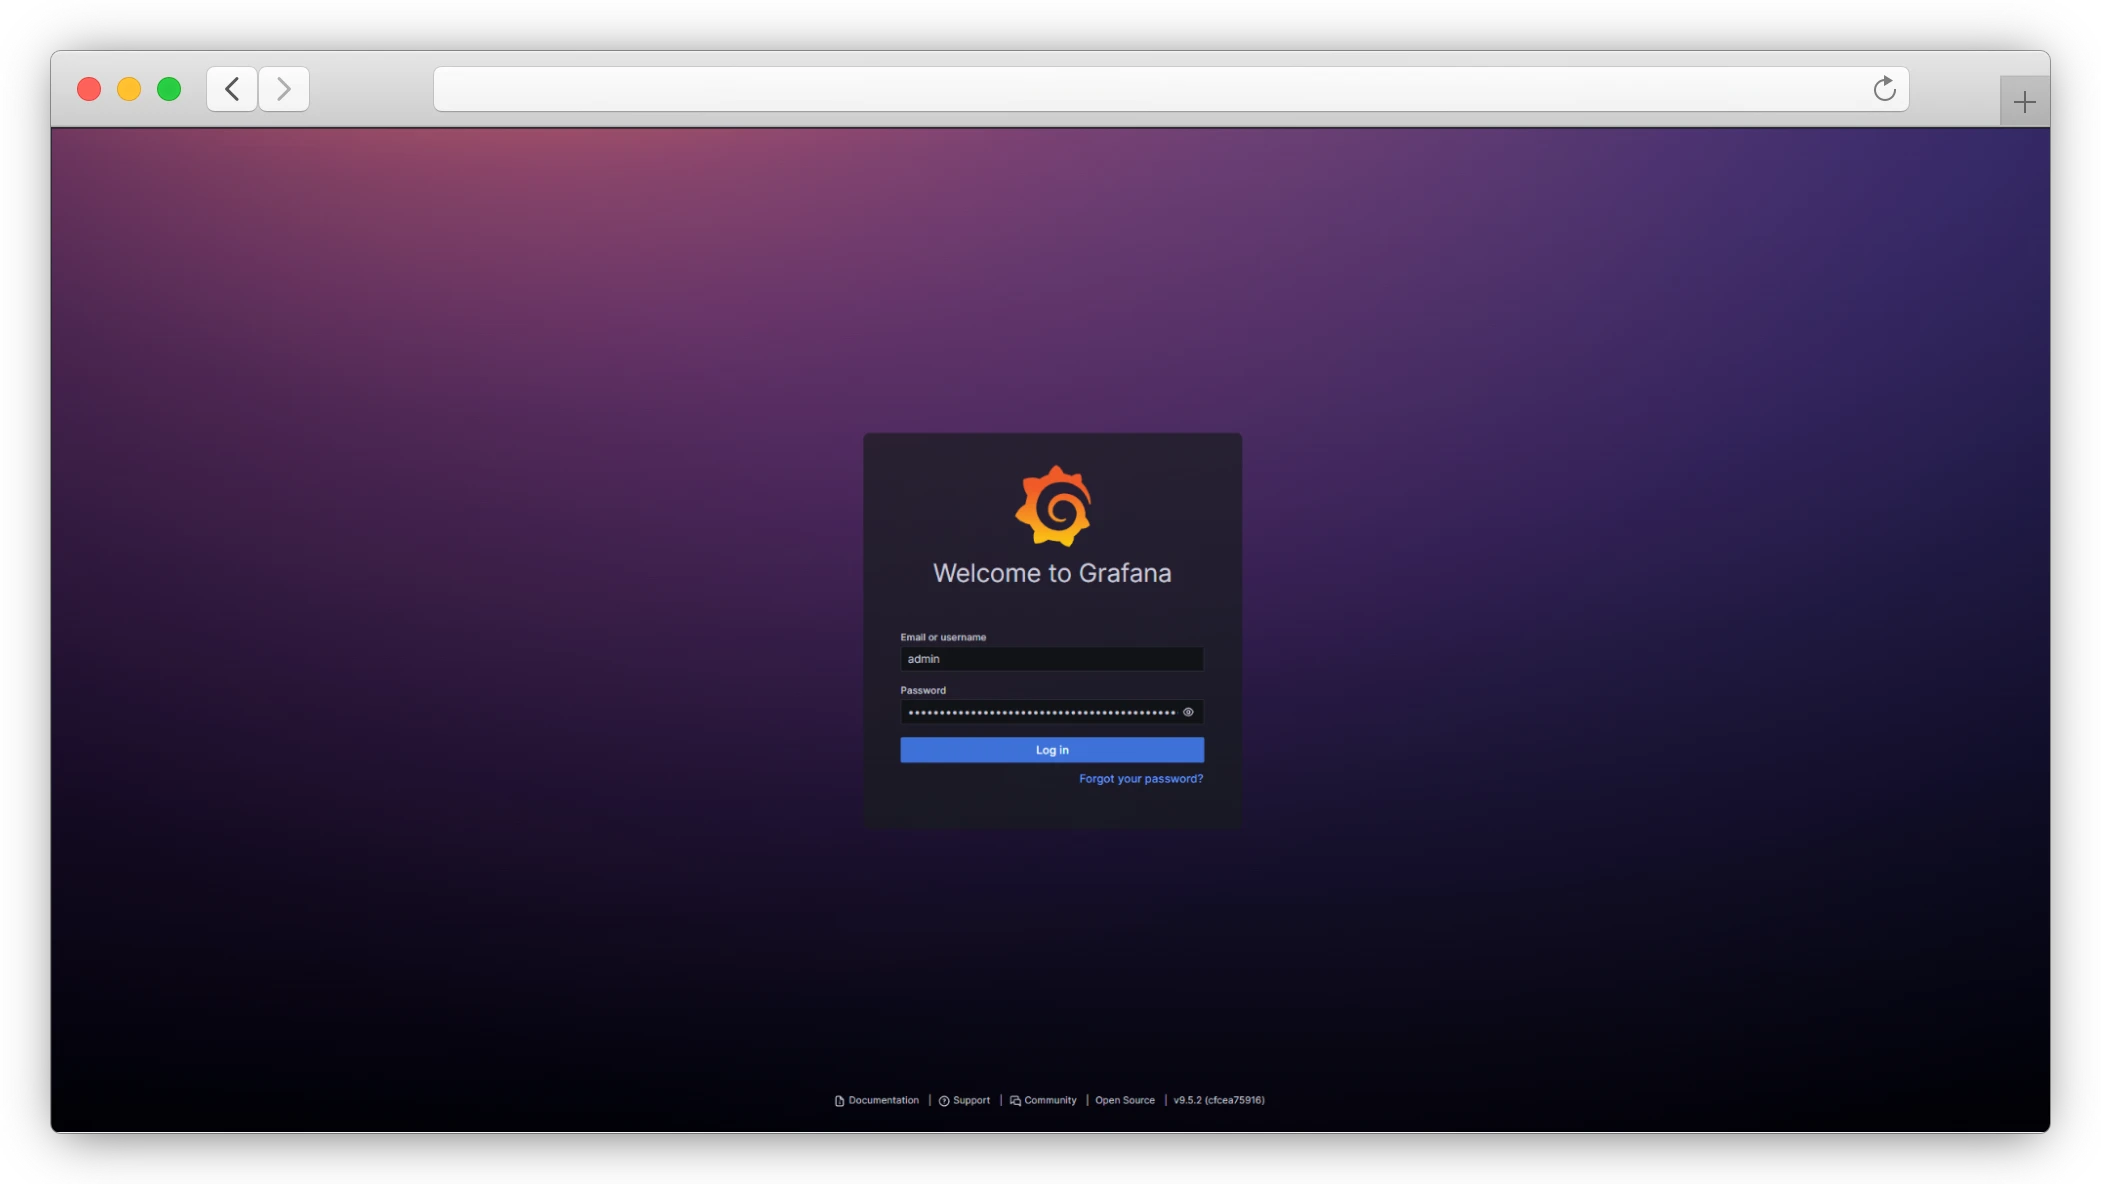
To log in, use the login/email and password that you specified when you created the VPS. They also were sent to the account contact email and are available in the installed application information window in the virtual server control panel.
Adding a data source
To add a display data source in Grafana, click on the menu button in the upper right corner, expand the "Connections" section, and go to "Your connections".
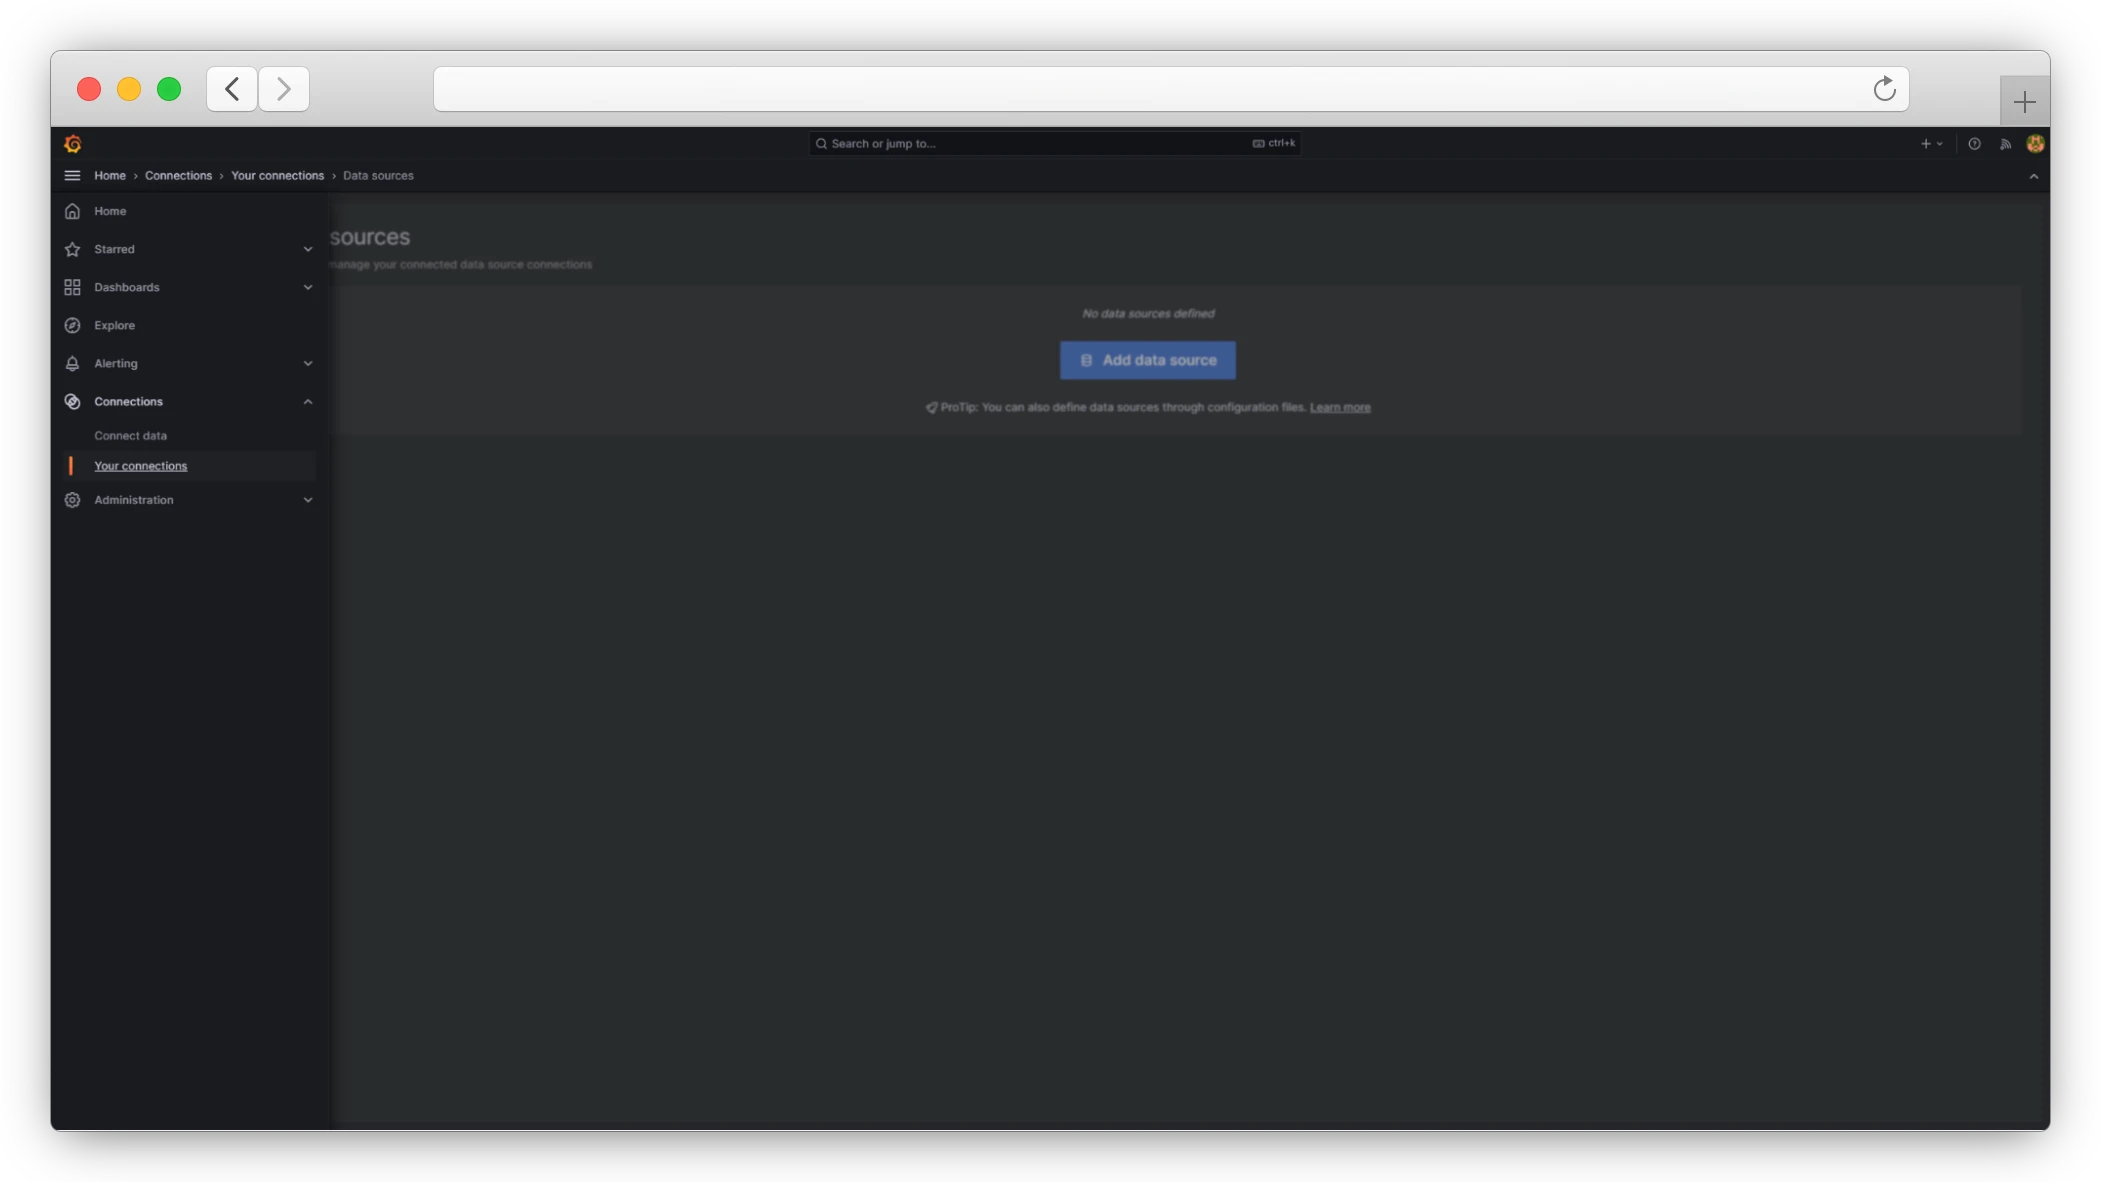
Click the "Add data source" button, select the data source, and specify the data to connect to it.
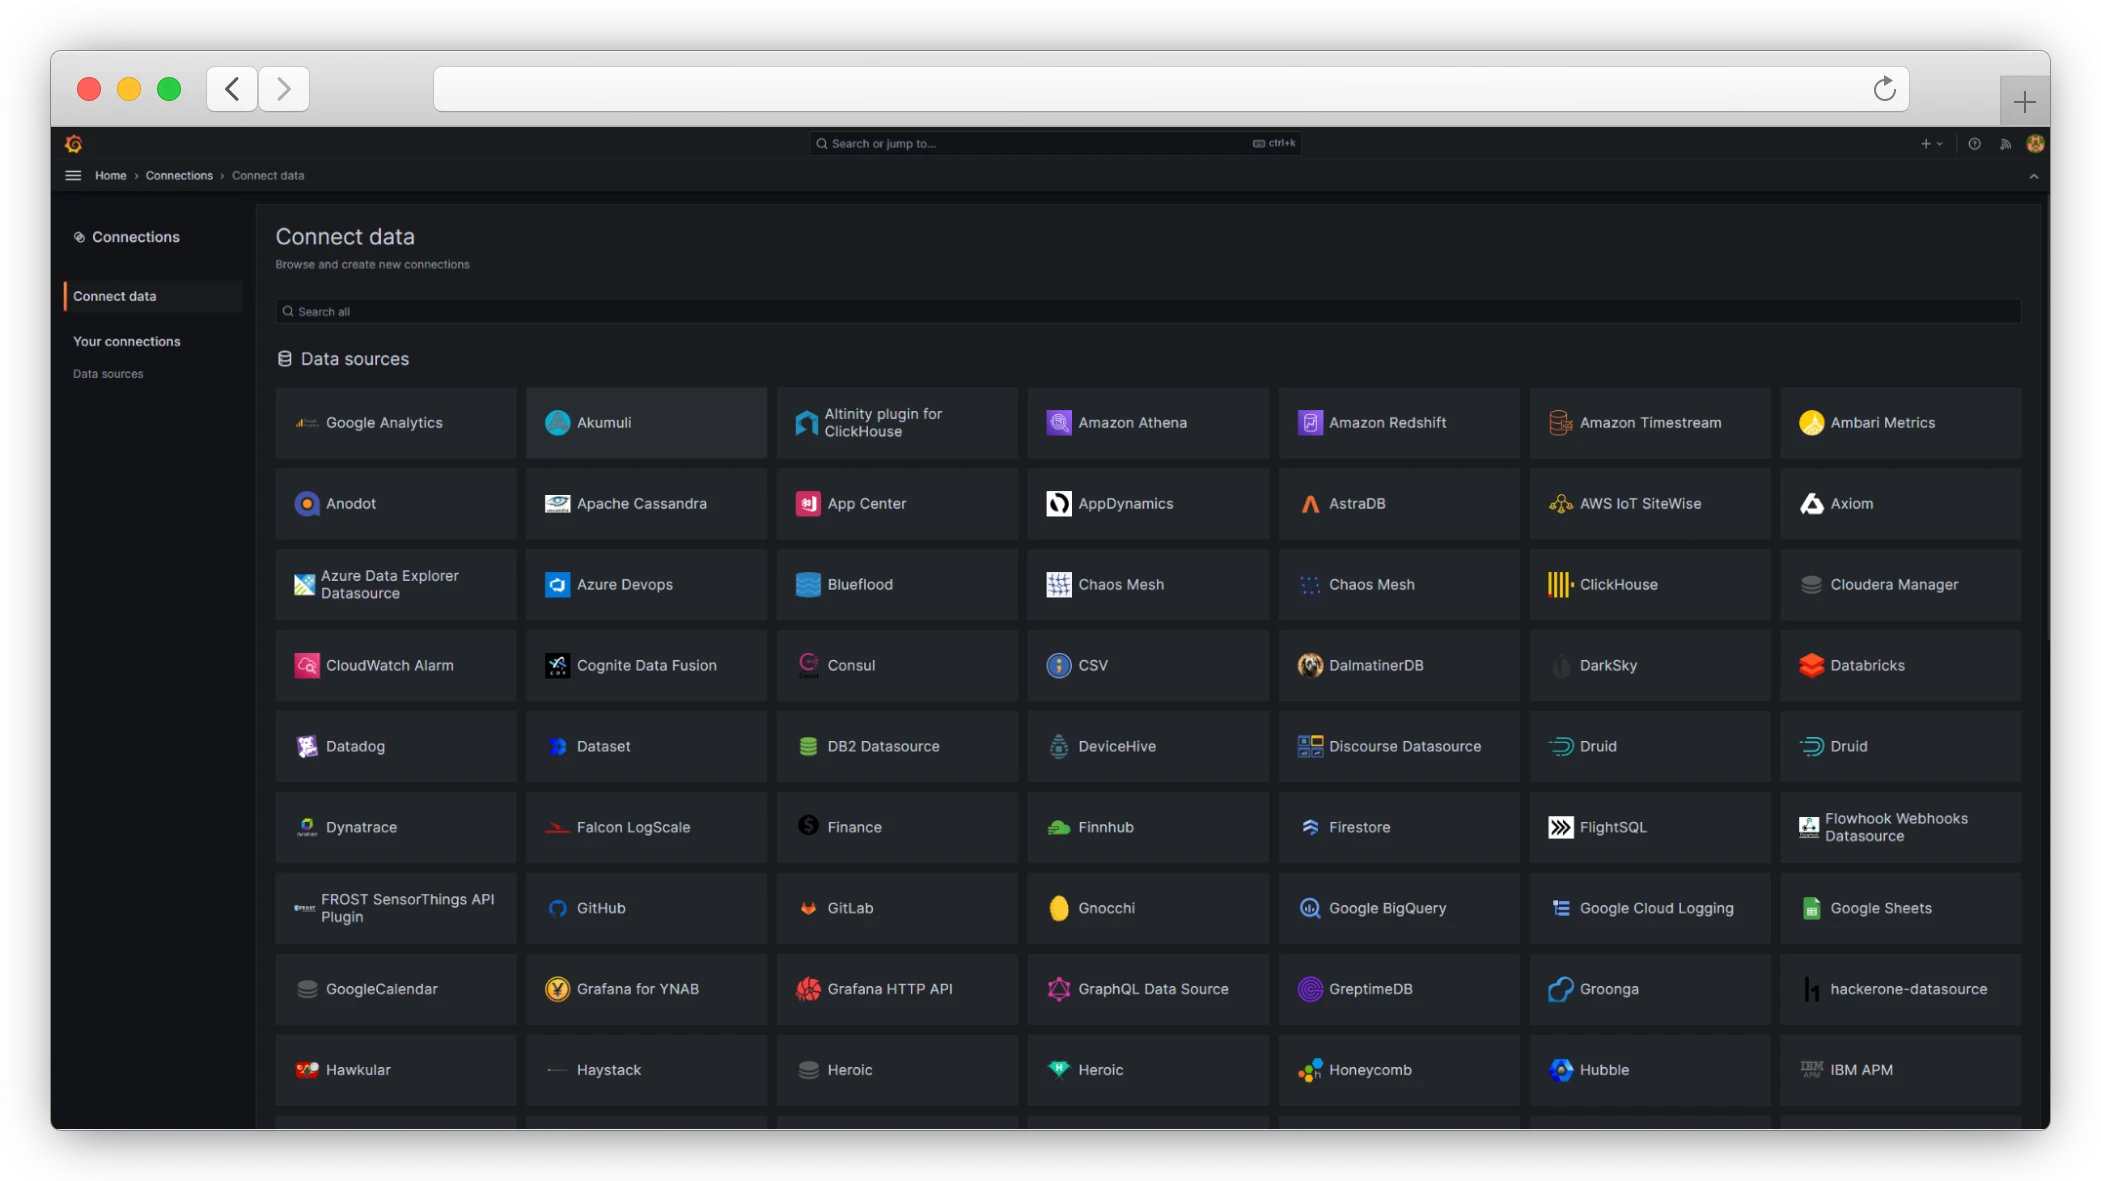
You can install additional data sources in the form of plug-ins on the "Connect Data" tab in the same section.
Adding a board and panels
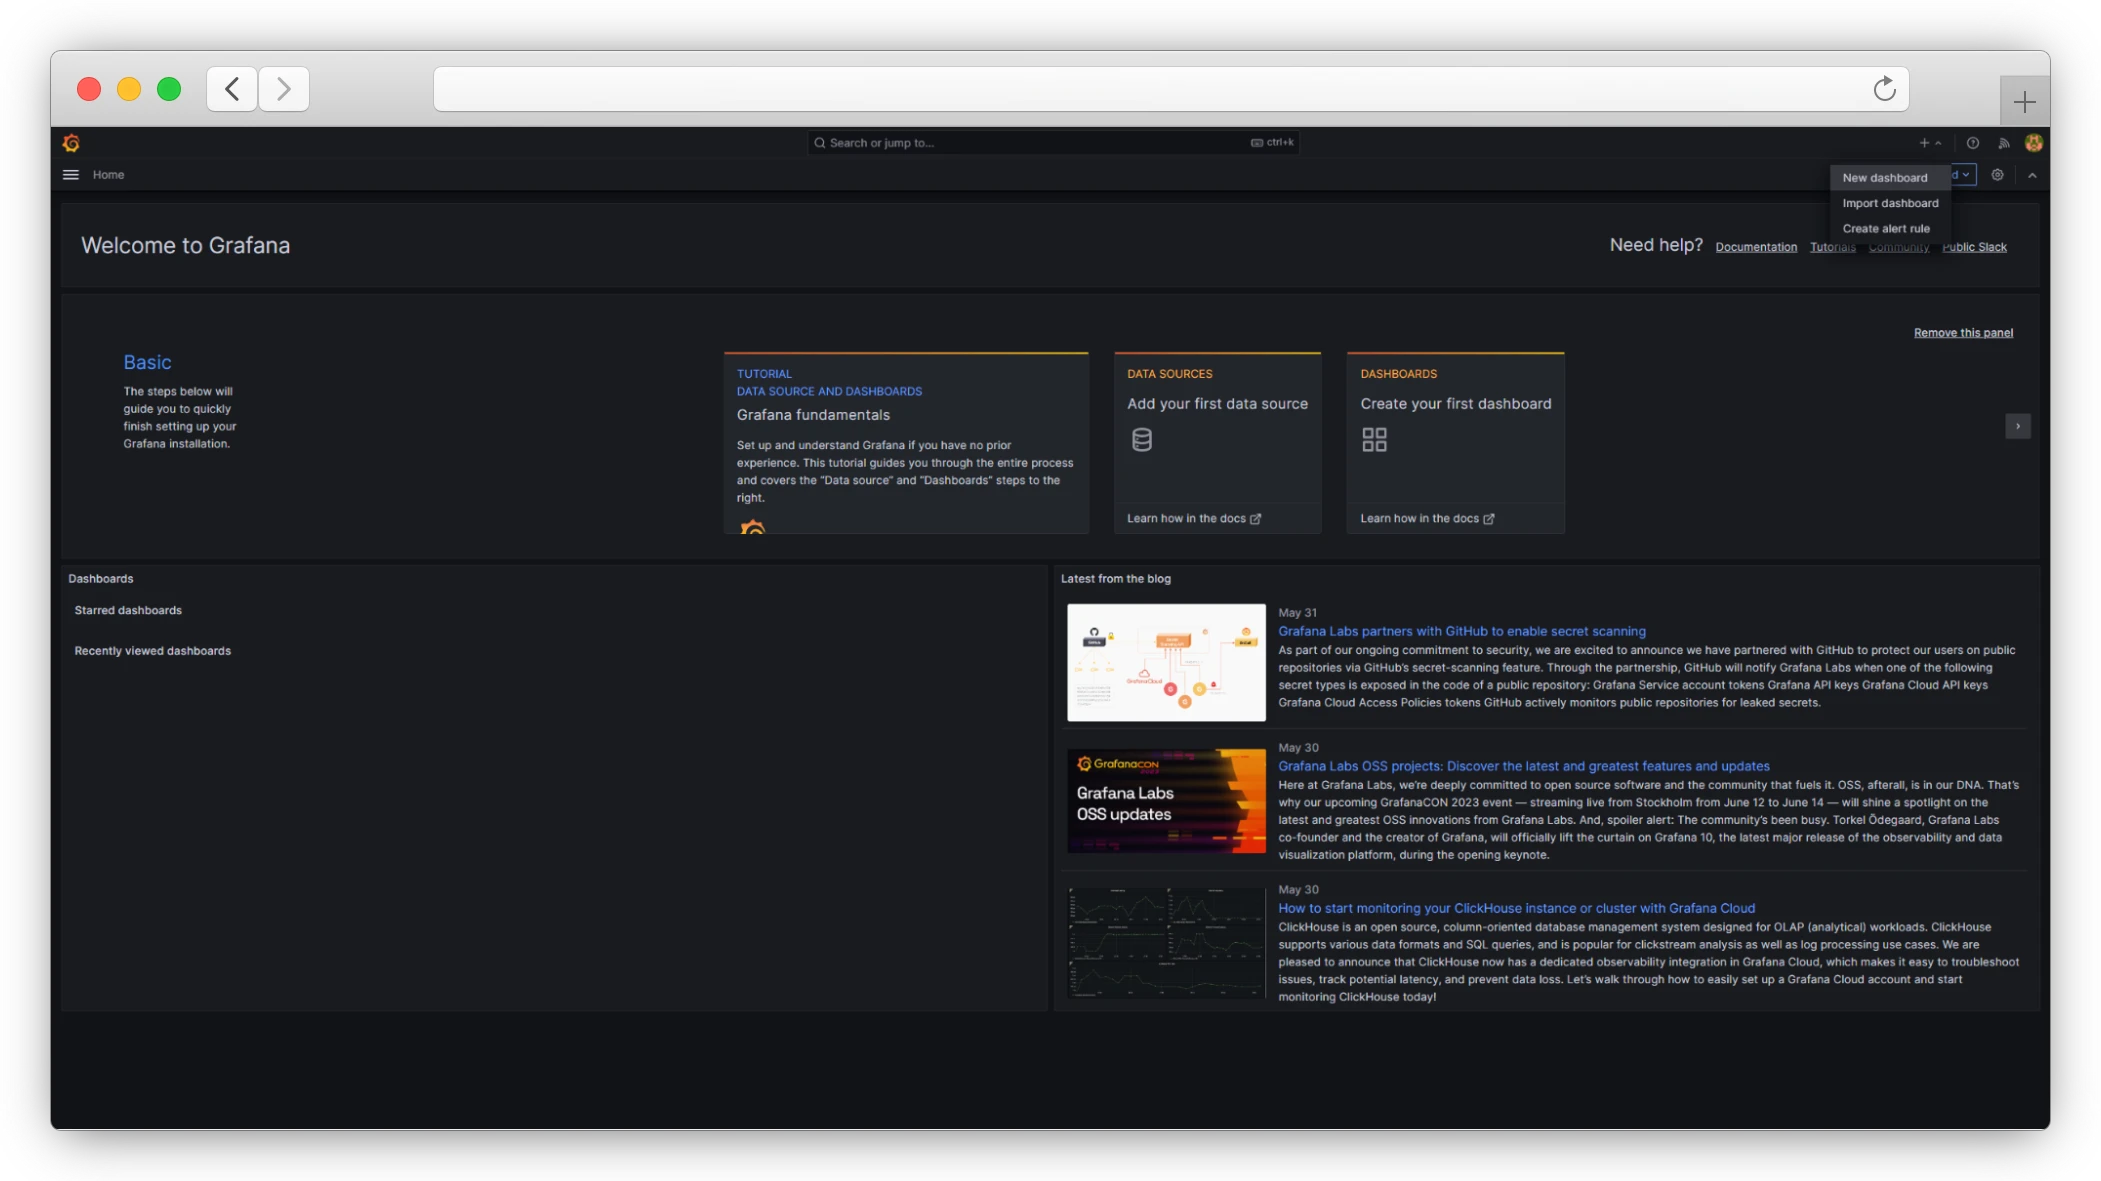
To add a board, click the "+" icon in the upper right corner of any page and select "New dashboard".
To add a panel to the board, click the "Add visualization" button, customize the panel, and click "Apply".
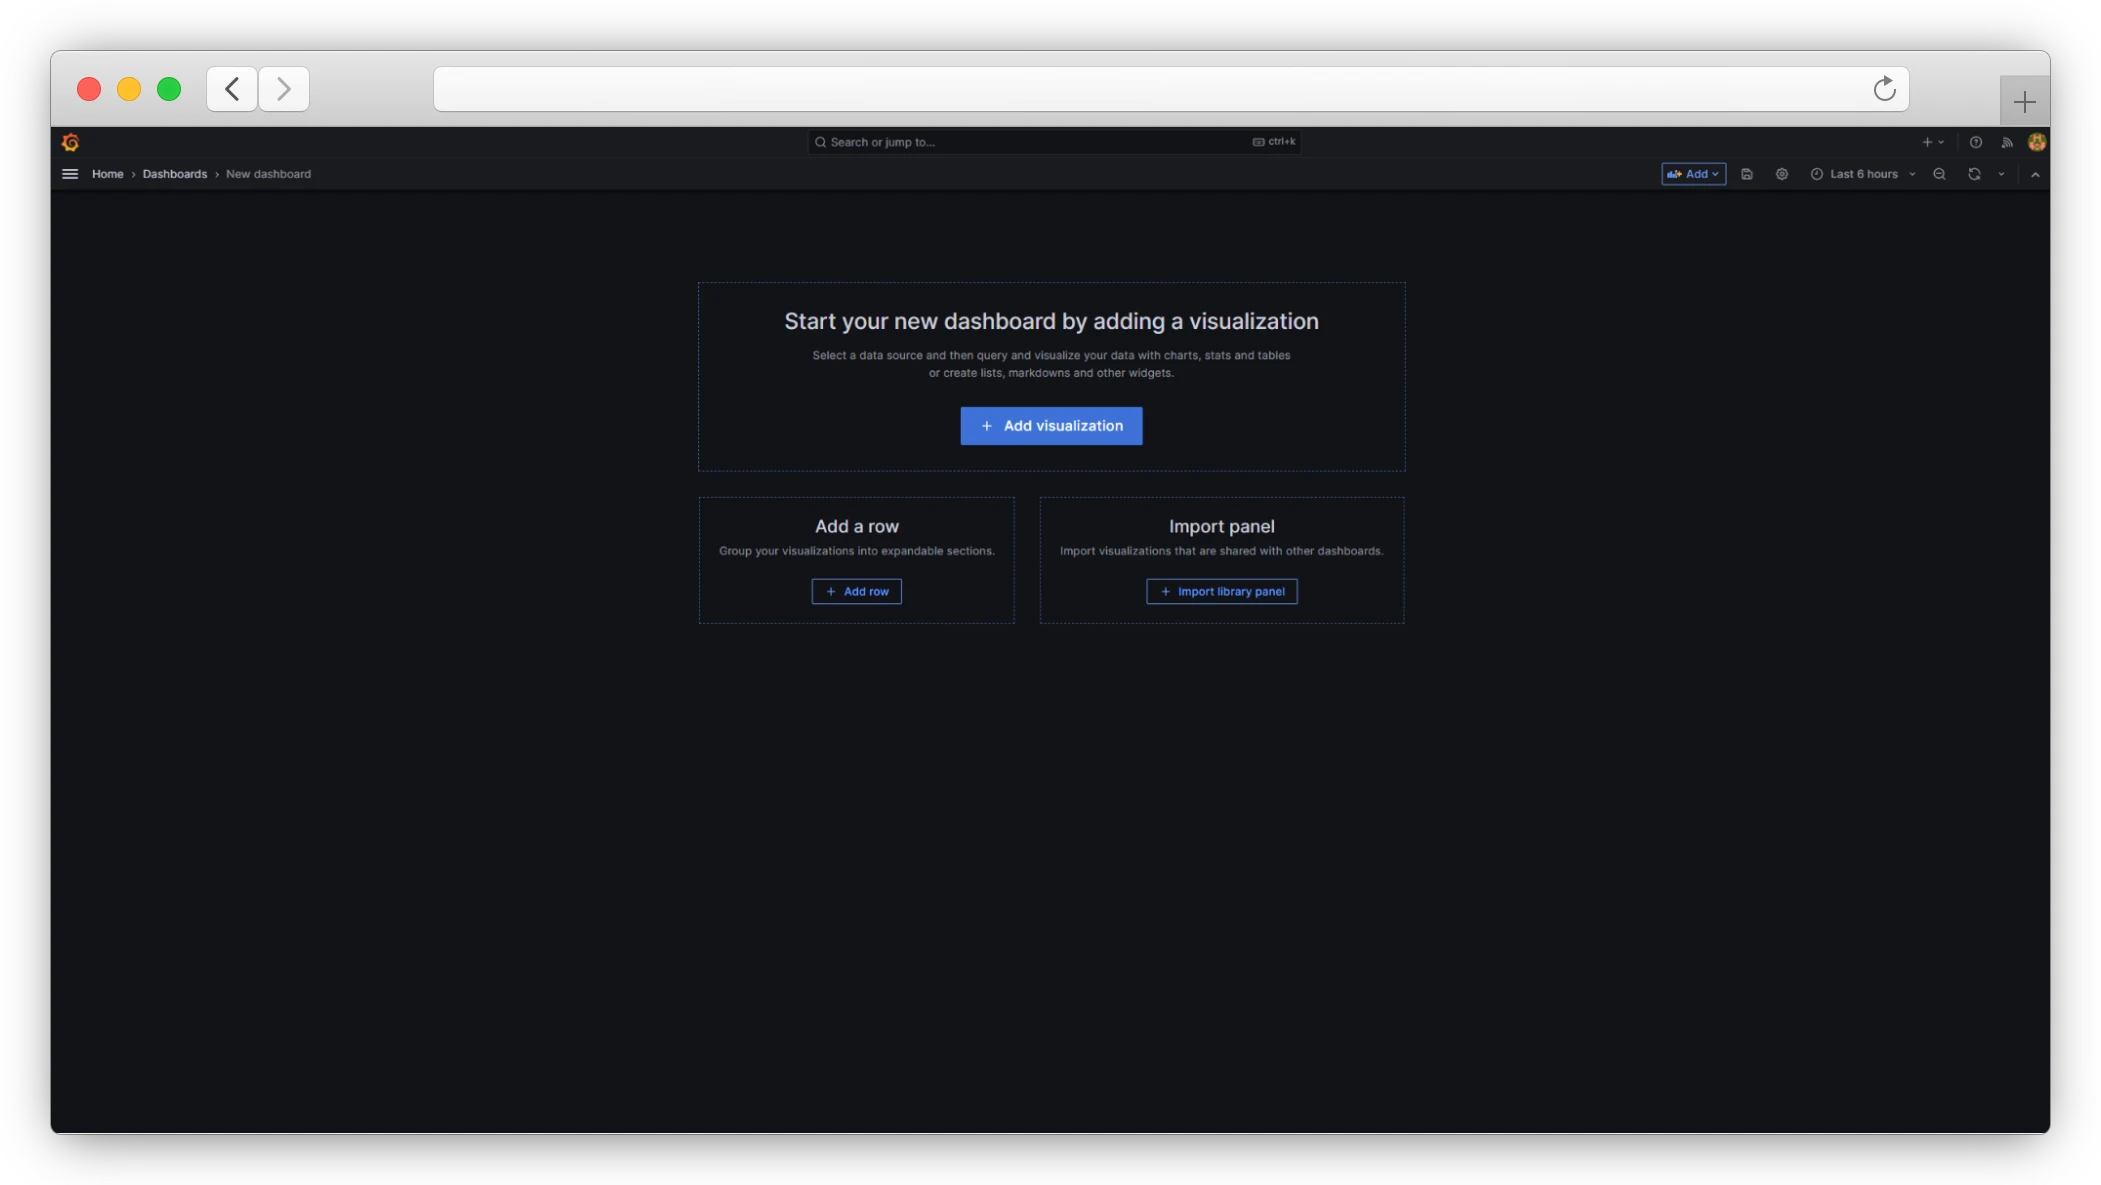
After setting up all the panels, do not forget to save all the changes. To do this, click on the "Save dashboard" button in the form of a floppy disk.

We wish you good luck with metrics tracking and time series data analysis with Grafana!
FAQ
All configuration files are stored in /opt/beget/grafana/.
The container startup configuration is contained in the file /opt/beget/grafana/docker-compose.yml.
Environment variables are contained in the file /opt/beget/grafana/.env.
Grafana's configuration information (e.g. configured boards) is contained in /opt/beget/grafana/provisioning/.
- Connect to the server via SSH:
ssh root@server_ip - Go to the Grafana directory with
cd /opt/beget/grafana - Restart the container with
docker-compose restart
- Connect to the server via SSH:
ssh root@server_ip - Go to the Grafana directory with
cd /opt/beget/grafana - Install the plugin by running:
docker exec grafana grafana-cli plugins install <plugin name>
Plugins for Grafana can be found in the official marketplace.
